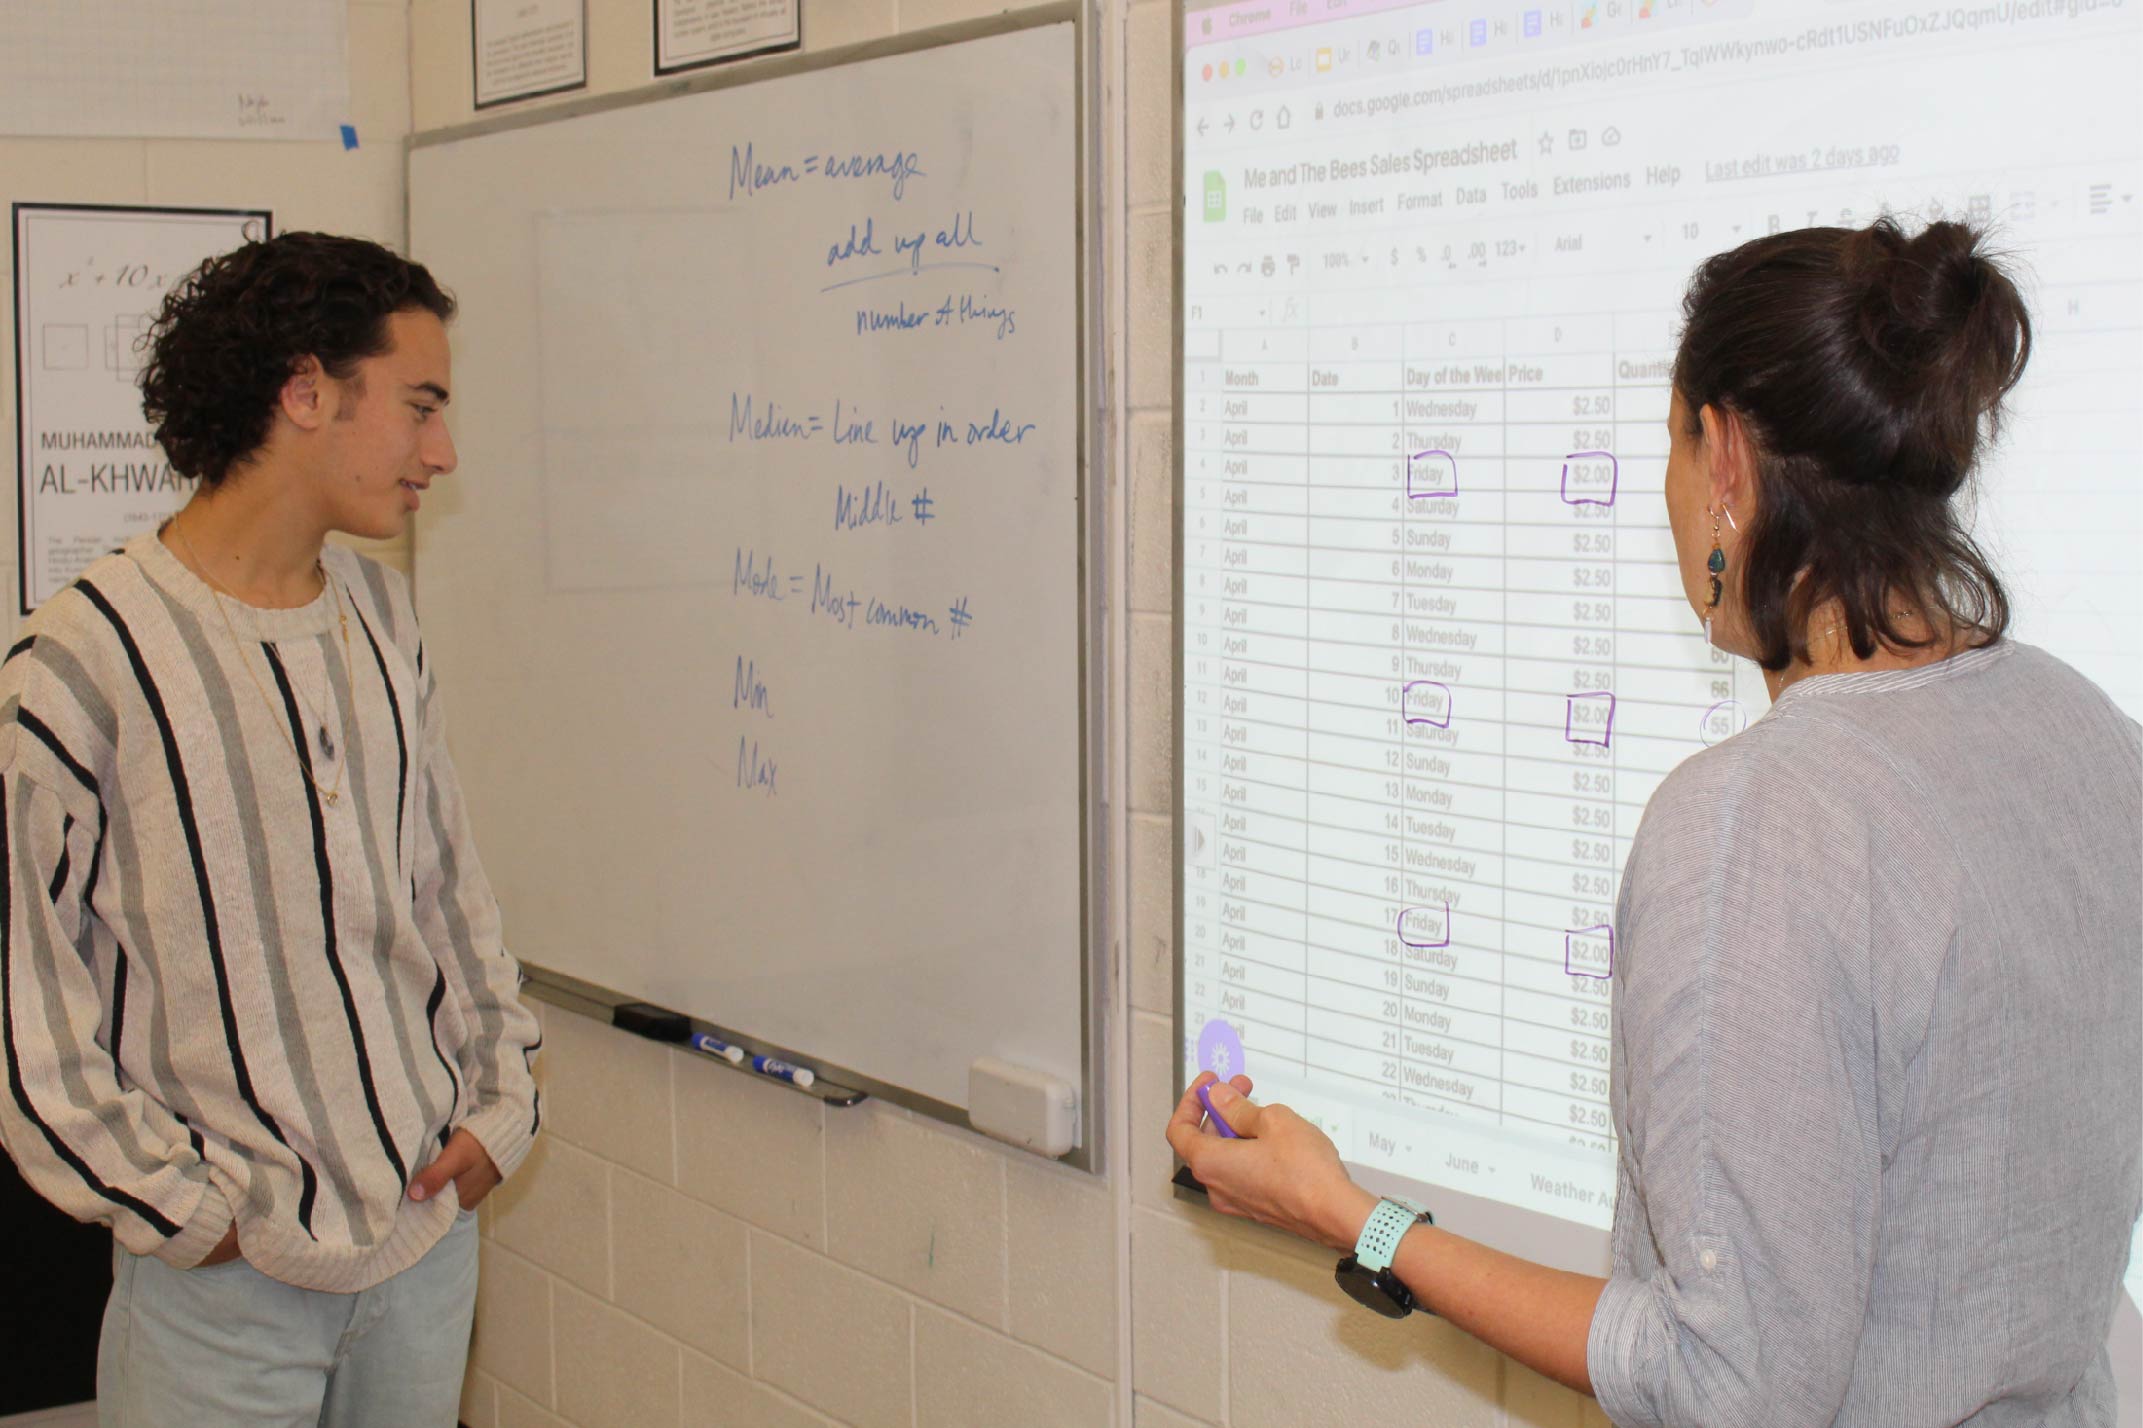
You may not see it, but the future is filled with data. Today’s students will be asked to engage with statistics in their lives and careers, from decisions of public policy to how best to market a business. This past year, Upper School Math Teacher Erin Bengtson decided to put together a new Statistics class with a simple but important goal: Improve students’ statistical literacy.
“After teaching AP Statistics for many years, I grew to love statistics and to recognize how important it is in modern society,” says Erin. “We encounter data, percentages, and statistical information almost constantly in media and society, but most of us don’t know where the data comes from, how it was analyzed, and what the numbers really mean. In this class, my whole goal is to make students data literate through plenty of projects with real-world applications.”
Elias Mirsky ’23 is one of the students taking this inaugural class. He often wears his Skullcandy headphones around his neck, the headband taped from loving use.
“I honestly chose this Statistics class because I needed a math class,” Eli admits with a laugh. “I wasn’t expecting to enjoy it as much as I am. The first project really started us on a good note.”
 For their first project, Erin had them collect data about something that they do regularly in everyday life.
“This project helps students understand that their personal lives are full of data that can be recorded,” explains Erin. “Then, after collecting it, they have to make creative visuals to explore the many ways that data visualization can get the same data to tell different stories.”
Students went in a few different directions. One student chose how many times a day they drank water; another chose to count the frequency of their laughter.
But for Eli, he wanted to learn more about his relationship with music.
“I use an app that tracks a lot of information about my listening,” says Eli. “The amount of time I listen to something, the number of times, the album, the artist. I transferred a week’s worth of that data into a spreadsheet, breaking it down by the hour to see what patterns showed up.”
The results that Eli found were a little surprising, but not totally unexpected.
“I found that I spend a lot of time listening to music over the weekend, when I have more free time,” he explains. “I love listening to music, so it was kind of shocking. But it did make sense, because I don’t listen when I’m doing work or anything else: When the music’s on, I want to be focusing entirely on that. So it’s cool that the story in this data backs that up.”
By having the students not only collect the data but visualize it, Erin hopes that students become more familiar with the ways people can manipulate statistics. “Visuals are one of the primary tools we use to tell a story about data,” says Erin. “And hopefully they also reflect on how the process of collecting data can actually change the way we think about the things we do.”
Indeed, without the visualization, Eli would not have seen the rhythm of his week in music as clearly — the spaces in his life where there is no soundtrack.
“The points of data that are visualized tell a great story, but what’s almost more cool is the empty space,” says Eli. “I put together a timeline to visualize it. When I chose to display the data in the way that I did, I didn’t think about all the hours of the day that I wasn’t listening to music. This resulted in the final product having a lot less filled space than I thought it would. Looking at the visuals, you might think that I just wasn’t that into music.
“But still, the absence of marks in the space really shows the days that I was busiest, the days I was most emotional, the days I needed to relax. As long as you know what you’re looking at, you know the context, the visuals really do tell a story.”
For Erin, teaching this class has been a long time coming. “I’ve been dreaming of teaching this class for years,” she says. “I believe that statistical literacy is incredibly important! Being able to scrutinize the way that data is presented can help you see how the simple story might be skewed to one perspective. And at the end of the class, I hope that students become skeptical and analytical consumers of data.”
Eli agrees. “This type of project is not something I would have thought to do on my own,” says Eli. “But it’s taught me that statistics can be applied to life in general. It’s why I appreciate this class — there are so many ways to connect with the material.”